Org chart in Power Bi with PATH function
- Michal Kulikowski
- Aug 7, 2023
- 2 min read
Updated: Aug 8, 2023
One of the challenges Power BI developers might have is how to handle Employee - Manager relations. Usually we store employee data in one table and some of those employees are managers to other employees in the same table... We call it recursive relationship.
So one employee can have only one manager and one manager can have multiple employees.
Let's take an example:
We have an 'Employee' table with Employee ID:

2. Then we have another ('EmpManager') table where we assign ID's creating this relation between an employee and another employee from the same table:

So looking at this example employee with ID = 2 is a supervisor to employees with ID's: 6,7,8,9
and then employee with ID = 6 is supervisor to employees with ID's: 15,16,17,18
We can see that there are multiple levels here.
How to handle this in Power BI and add a calculated column? Actually there is a very useful function called PATH. We can then create an Org chart in Power Bi with this PATH function
In our case this would look like this in DAX:
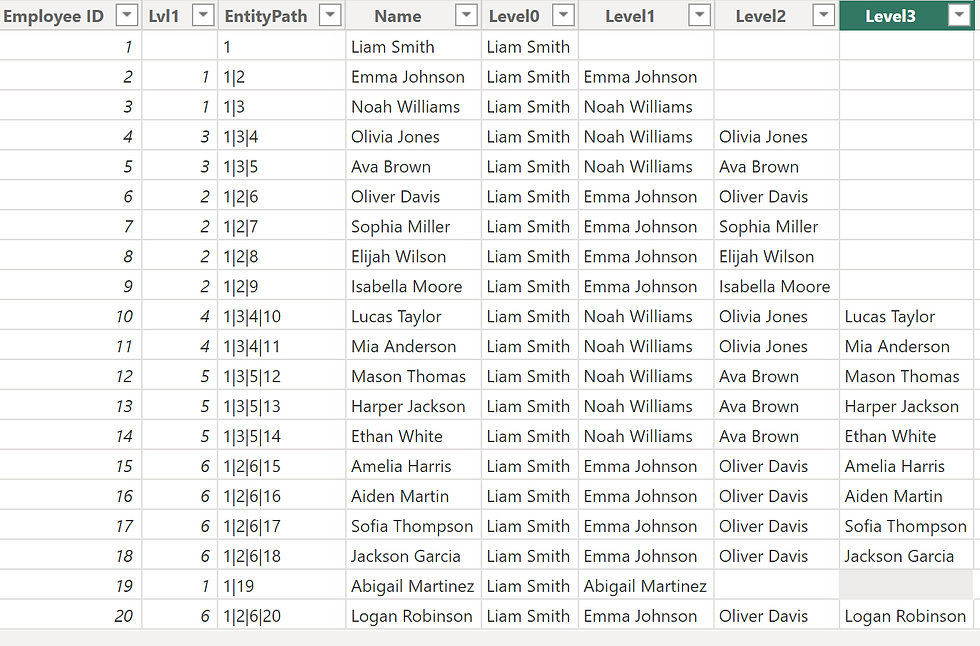
EntityPath = PATH ( EmpManager[Employee ID], EmpManager[Lvl1] )

And the result:

Now we want to display names of the managers as calculated columns with another related and very handy function PATHITEM
Level0 = VAR LevelNumber = 1 VAR LevelKey = PATHITEM( EmpManager[EntityPath], LevelNumber, INTEGER ) VAR LevelName = LOOKUPVALUE ( EmpManager[Name], EmpManager[Employee ID], LevelKey ) VAR Result = LevelName RETURN Result
And the result below:
Please note I have added a calculated column Name

So in HR organizations our top level is called level 0
So changing the level variable in the DAX code you can display all the levels available:
Having this organizational structure resolved in Power BI with DAX now we can move on to create some fancy visualizations like below:


Comments